Logs and tracing in Rust: From Terminal to Grafana
Caroline Morton
May 23, 2026
This is the third part of a series on logging and tracing in Rust. The first part covered the fundamentals and the second part covered structured fields and spans. This series accompanies my Women in Rust talk on this topic but should stand alone as a reference.
In the first two posts, all of our logs have been going to the terminal. That is fine for development, but in production you need your logs somewhere you can search, filter and alert on them. Alert in this context might mean pinging a slack channel or emailing someone. In this post we are going to take everything we have built so far and ship it to Grafana via Loki. By the end of this post, you will be able to query your structured fields and spans in a real dashboard. We are going to do all of this locally with Docker Compose and write logs to a file locally so we don’t have to worry about any cloud infrastructure or setting up a full production pipeline. The aim of this blog post is to show you the bare minimum so you can get your logs into Grafana and start querying them, not to show you how to set up a production ready logging pipeline. I hope at the end of this post, you have a basic rust app to grafana pipeline running and you can see the possibilities of having structured logs in a log aggregation tool. You can then take that knowledge and apply it to your own projects and production pipelines as you see fit.
The code for this post is available in this repository if you want to try it out yourself. I am going to be sticking with the example of synthetic patient generation that I have been using throughout this series - mostly because that is a big interest of mine and I have already instrumented it with tracing, so it is a nice example to use for showing how to ship logs to Grafana. But the concepts in this post apply to any Rust application, so you should still be able to follow along and apply the same principles to your own projects. The codebase itself is very minimal so we can concentrate on the core learning of what logs are, how to structure them, and how to get them into Grafana.
What is Grafana Loki?
Before we set up the infrastructure, it is worth briefly explaining what the different pieces are and how they fit together.
Grafana is a dashboarding and visualisation tool that you have probably seen it before. It is the thing with the graphs and the dark background that you often see at conferences. On its own, Grafana does not store any data. It connects to data sources and lets you query and visualise them.
Loki is a log aggregation system built by the Grafana team. It is designed to store and index logs. It is optimised for storing large volumes of logs and making them queryable. We are going to be using Loki as our log storage backend.
Promtail is a program that ships logs from our Rust app to Loki. It can read from files, from Docker container logs, from the systemd journal, and from various other sources. In our setup, it is going to read the log files that our Rust application writes to disk and forward them to Loki. In production, you would probably be running the Rust app in Docker and Promtail would be scraping logs from an endpoint or from container logs.
The flow is: your Rust application writes JSON logs to a file locally, Promtail reads that file and sends the log entries to Loki, and Grafana queries Loki to display them.
Our example application
We are going to continue with the synthetic patient generation example from the previous posts. Incidentally if you want to know more about synthetic data, I have written a lot about it here. To make things more realistic, we are going to wrap it in a loop that continuously generates patients with some artificial delays to simulate latency, and we are going to introduce some random failures so we have errors to look at in Grafana. You will see that I have created this via a random number generator and std::thread::sleep calls. Again this is just a toy example to give us some data to work with, not a real application.
There are two important changes from the previous posts. Firstly, we are switching the subscriber to JSON output using .json(). Every log line will be emitted as a single JSON object, which is what Loki expects. Secondly, instead of writing logs to the terminal, we are using the tracing-appender crate to write them to a file. This is what Promtail will read from.
We also want to be able to query on how long operations take. In the previous post we saw that FmtSpan::CLOSE gives us a time.busy field when a span closes, but that field is emitted as a string like "45.3ms" which is not easy to do numeric comparisons on in Loki. Instead, we are going to log the elapsed time ourselves as a numeric field in milliseconds. This gives us full control over the field and means we can write queries like “show me all database writes that took longer than 150ms”.
Let’s quickly walk through the code. The full code is in the repository linked here - where you can see all the imports and structs - but the key parts are the logging and the subscriber setup. Firstly our Cargo.toml dependencies:
[package]
name = "patient-generator"
version = "0.1.0"
edition = "2021"

[dependencies]
tracing = "0.1"
tracing-subscriber = { version = "0.3", features = ["env-filter", "json"] }
tracing-appender = "0.2"
uuid = { version = "1", features = ["v4"] }
rand = "0.8"
Note that we have added the json feature flag to tracing-subscriber and we are using the tracing_appender crate to write logs to a file instead of stdout. This allows us to emit structured JSON logs to a file that Promtail can read and ship to Loki.
In order to make this demo more interesting, I have written some code where we are experiencing some artificial latency and some random failures. This is to give us some interesting data to look at in Grafana. The key thing to notice is that we are logging the elapsed time of operations as a numeric field in milliseconds, which will allow us to do numeric queries in Grafana. Here are the key functions with the logging:
#[tracing::instrument]
fn generate_demographics() -> Demographics {
    let start = std::time::Instant::now();

    let delay = rand::thread_rng().gen_range(10..50);
    std::thread::sleep(Duration::from_millis(delay));

    let age = rand::thread_rng().gen_range(0..100);
    let sex = if rand::thread_rng().gen_bool(0.5) {
        "M".to_string()
    } else {
        "F".to_string()
    };
    let demographics = Demographics { age, sex };
    let elapsed_ms = start.elapsed().as_millis() as u64;
    tracing::info!(
        age = demographics.age,
        sex = %demographics.sex,
        elapsed_ms,
        "generated patient demographics"
    );
    demographics
}

#[tracing::instrument(fields(age = demographics.age), skip(demographics))]
fn generate_medical_history(demographics: &Demographics) -> Vec<String> {
    let start = std::time::Instant::now();

    let delay = rand::thread_rng().gen_range(20..100);
    std::thread::sleep(Duration::from_millis(delay));

    // For simplicity, we are just generating two random diagnosis codes. In a real application,
    // this would be from a database with some statistical correlation with the demographics.
    let diagnoses = vec!["E11.9".to_string(), "I10".to_string()];
    let elapsed_ms = start.elapsed().as_millis() as u64;
    tracing::info!(
        diagnoses_count = diagnoses.len(),
        elapsed_ms,
        "generated patient medical history"
    );
    diagnoses
}

#[tracing::instrument(skip(patient))]
fn write_to_database(patient: &Patient) -> Result<(), String> {
    let start = std::time::Instant::now();

    let delay = rand::thread_rng().gen_range(50..200);
    std::thread::sleep(Duration::from_millis(delay));

    let elapsed_ms = start.elapsed().as_millis() as u64;

    // Introduce some random failures to have some errors to look at in Grafana.
    // I have pinned this at around a 10% failure rate so we have a good amount
    // of errors without overwhelming the logs.
    if rand::thread_rng().gen_bool(0.1) {
        tracing::error!(
            patient_id = %patient.id,
            elapsed_ms,
            error = "connection refused",
            "failed to write patient to database"
        );
        return Err("connection refused".to_string());
    }
    tracing::info!(
        patient_id = %patient.id,
        elapsed_ms,
        "wrote patient to database"
    );
    Ok(())
}
Our functions are annotated with #[tracing::instrument] which means that a span will be automatically created for each function call and the fields we specify will be attached to that span. We are also logging the elapsed time of each operation as a numeric field in milliseconds, which will allow us to do numeric queries in Grafana.
Finally, our main function sets up the subscriber to write JSON logs to a file and then continuously generates patients in a loop:
fn main() {
    let file_appender = tracing_appender::rolling::daily("logs", "patient-generator.log");
    let (non_blocking, _guard) = tracing_appender::non_blocking(file_appender);

    tracing_subscriber::fmt()
        .json()
        .with_writer(non_blocking)
        .with_env_filter(
            EnvFilter::try_from_default_env()
                .unwrap_or_else(|_| EnvFilter::new("info")),
        )
        .init();

    tracing::info!("starting synthetic patient generator");

    loop {
        // We loop indefinitely generating patients so we have a continuous stream of logs
        // to work with in Grafana.
        generate_patient();

        let delay = rand::thread_rng().gen_range(500..2000);
        std::thread::sleep(Duration::from_millis(delay));
    }
}
If you run cargo run, you should see a logs/ directory appear in your project with a log file filling up with JSON. In practice, each log entry is a single line of JSON, but I have formatted this one for readability:
{
  "timestamp": "2026-05-21T22:02:24.627310Z",
  "level": "INFO",
  "fields": {
    "message": "generated patient demographics",
    "age": 57,
    "sex": "F",
    "elapsed_ms": 12
  },
  "target": "patient_generator",
  "span": {
    "name": "generate_demographics"
  },
  "spans": [
    {
      "patient_id": "52ba6f89-703a-4f29-a093-a4f05f3541d7",
      "name": "generate_patient"
    },
    {
      "name": "generate_demographics"
    }
  ]
}
The output is a stream of JSON objects, one per log line, and it is not particularly human readable. But it is structured and machine readable. At a high level, we can see the timestamp, the log level, the fields (including our structured fields like age, sex, diagnoses_count and elapsed_ms), the target module, and information about the spans. This is the structured logging output that we will be shipping to Loki. Notice the elapsed_ms field is a number, not a string. This is what will let us do numeric queries in Grafana.
Setting up Grafana, Loki and Promtail
We are going to use Docker Compose to run Grafana, Loki and Promtail. You will need two configuration files alongside your docker-compose.yml. Make sure all of these files are in the same directory as your Rust project’s Cargo.toml and logs/ directory. If Docker cannot find the configuration files when it tries to mount them into the containers, you will get an error.
If you want to read more about any of these tools, the official documentation is here: Grafana, Loki, Promtail.
First, docker-compose.yml:
version: "3.8"

services:
  loki:
    image: grafana/loki:2.9.0
    ports:
      - "3100:3100"
    volumes:
      - ./loki-config.yml:/etc/loki/local-config.yaml
    command: -config.file=/etc/loki/local-config.yaml

  promtail:
    image: grafana/promtail:2.9.0
    volumes:
      - ./promtail-config.yml:/etc/promtail/config.yml
      - ./logs:/logs:ro
    command: -config.file=/etc/promtail/config.yml
    depends_on:
      - loki

  grafana:
    image: grafana/grafana:latest
    ports:
      - "3000:3000"
    environment:
      - GF_SECURITY_ADMIN_PASSWORD=admin
    depends_on:
      - loki
This defines our three services. Loki and Promtail each have their configuration files mounted in from the local directory. The promtail service also mounts your local logs/ directory as /logs inside the container in read-only mode, which is how Promtail reads the log files that your Rust application writes. Grafana is configured with a default admin password of admin.
Next, loki-config.yml:
auth_enabled: false

server:
  http_listen_port: 3100

common:
  path_prefix: /loki
  storage:
    filesystem:
      chunks_directory: /loki/chunks
      rules_directory: /loki/rules
  replication_factor: 1
  ring:
    kvstore:
      store: inmemory

schema_config:
  configs:
    - from: 2020-10-24
      store: tsdb
      object_store: filesystem
      schema: v13
      index:
        prefix: index_
        period: 24h
This is a minimal Loki config for local development. auth_enabled: false means we do not need to authenticate to send or query logs. I won’t go into the details of the Loki config here, but the key thing is that we are using the filesystem for storage and we have disabled authentication.
If you want to learn more about configuring Loki, the Loki configuration documentation covers all of the available options.
Finally, promtail-config.yml:
server:
  http_listen_port: 9080

positions:
  filename: /tmp/positions.yaml

clients:
  - url: http://loki:3100/loki/api/v1/push

scrape_configs:
  - job_name: patient-generator
    static_configs:
      - targets: [localhost]
        labels:
          app: patient-generator
          __path__: /logs/*.log*
    pipeline_stages:
      - json:
          expressions:
            level: level
            target: target
      - labels:
          level:
          target:
If we look at this Promtail config, the clients block tells Promtail where to send the logs it collects. In this case, it is sending them to our Loki instance at http://loki:3100/loki/api/v1/push.
The scrape_configs block is where we define a job called patient-generator and tell it to read from any files matching /logs/*.log*. The labels section attaches a static label app: patient-generator to every log line that comes from this job. This is what lets us write {app="patient-generator"} in our Grafana queries to filter for just our application’s logs.
The pipeline_stages section tells Promtail how to process each log line before sending it to Loki. We are using a json stage to parse the JSON and extract the level and target fields, and then a labels stage to promote those extracted values into Loki labels. This means that when we query in Grafana, we can filter by log level or by target module directly without Loki having to scan the full log text.
You might notice that Promtail reached end of life in March 2026 and has been replaced by Grafana Alloy. I am using Promtail in this post because the configuration is simpler and more readable, which makes it easier to understand what is happening when you are learning. The concepts are the same regardless of which agent you use: read JSON logs from a file, extract some fields as labels, and ship everything to Loki. If you are setting this up for a real project, you should use Alloy instead. Grafana provides a migration tool that can convert Promtail configs to Alloy configs with a single command.
Running it
You need two terminals:
In the first terminal, start your Rust application:
cargo run
In the second terminal, start the infrastructure:
docker compose up
Give it a minute for everything to start up. Now open Grafana in your browser at http://localhost:3000. Log in with username admin and password admin (it will ask you to change the password, you can skip this).
You need to add Loki as a data source:
- Go to Connections > Data Sources
- Click “Add data source”
- Select “Loki”
- Set the URL to
http://loki:3100 - Click “Save & test”
If the test is successful, you are ready to start querying.
Querying your logs
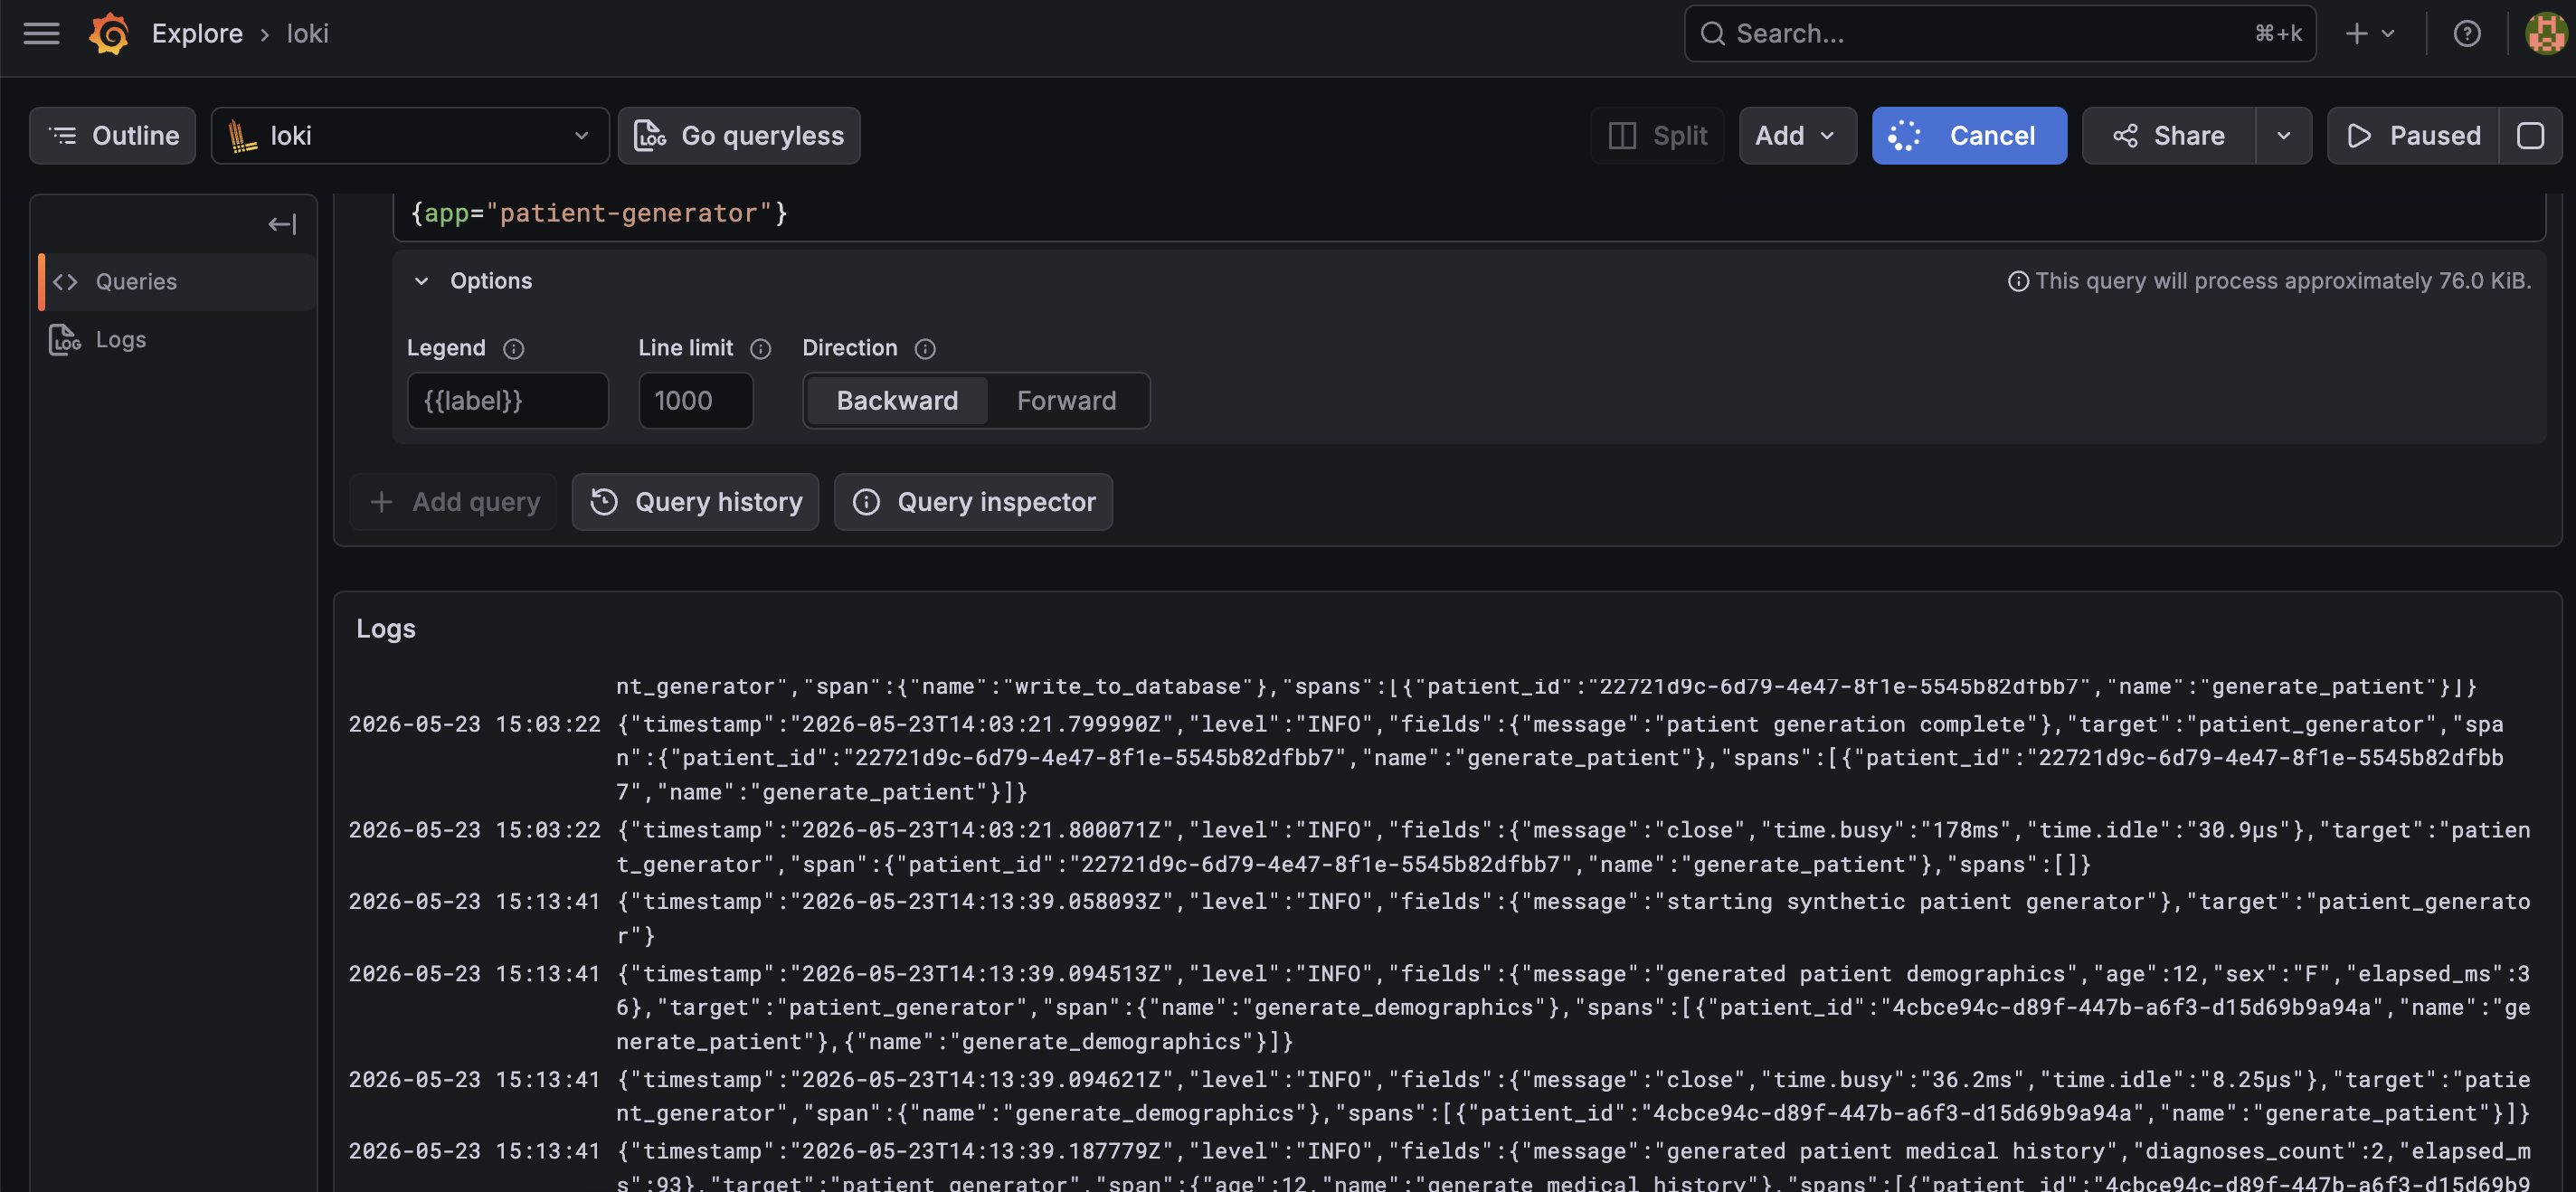
Go to the Explore page in Grafana (the compass icon in the sidebar) and make sure Loki is selected as the data source. In the query box, try:
{app="patient-generator"}
This will show you all logs from your Rust application. You should see the JSON log lines streaming in.
To see only errors:
{app="patient-generator", level="ERROR"}
This will show you just the failed database writes. Because we extracted level as a Loki label in our Promtail config, this filter is fast and does not require Loki to scan the log content.
To search for a specific patient by their ID:
{app="patient-generator"} |= "a0c7e4a-3f1d-4b5e-9c2f-8d6b3e1a7f04"
The |= operator does a substring match on the log line. This works but it is a brute force search. For more precise queries, you can parse the JSON and filter on specific fields:
{app="patient-generator"} | json | fields_message="wrote patient to database"
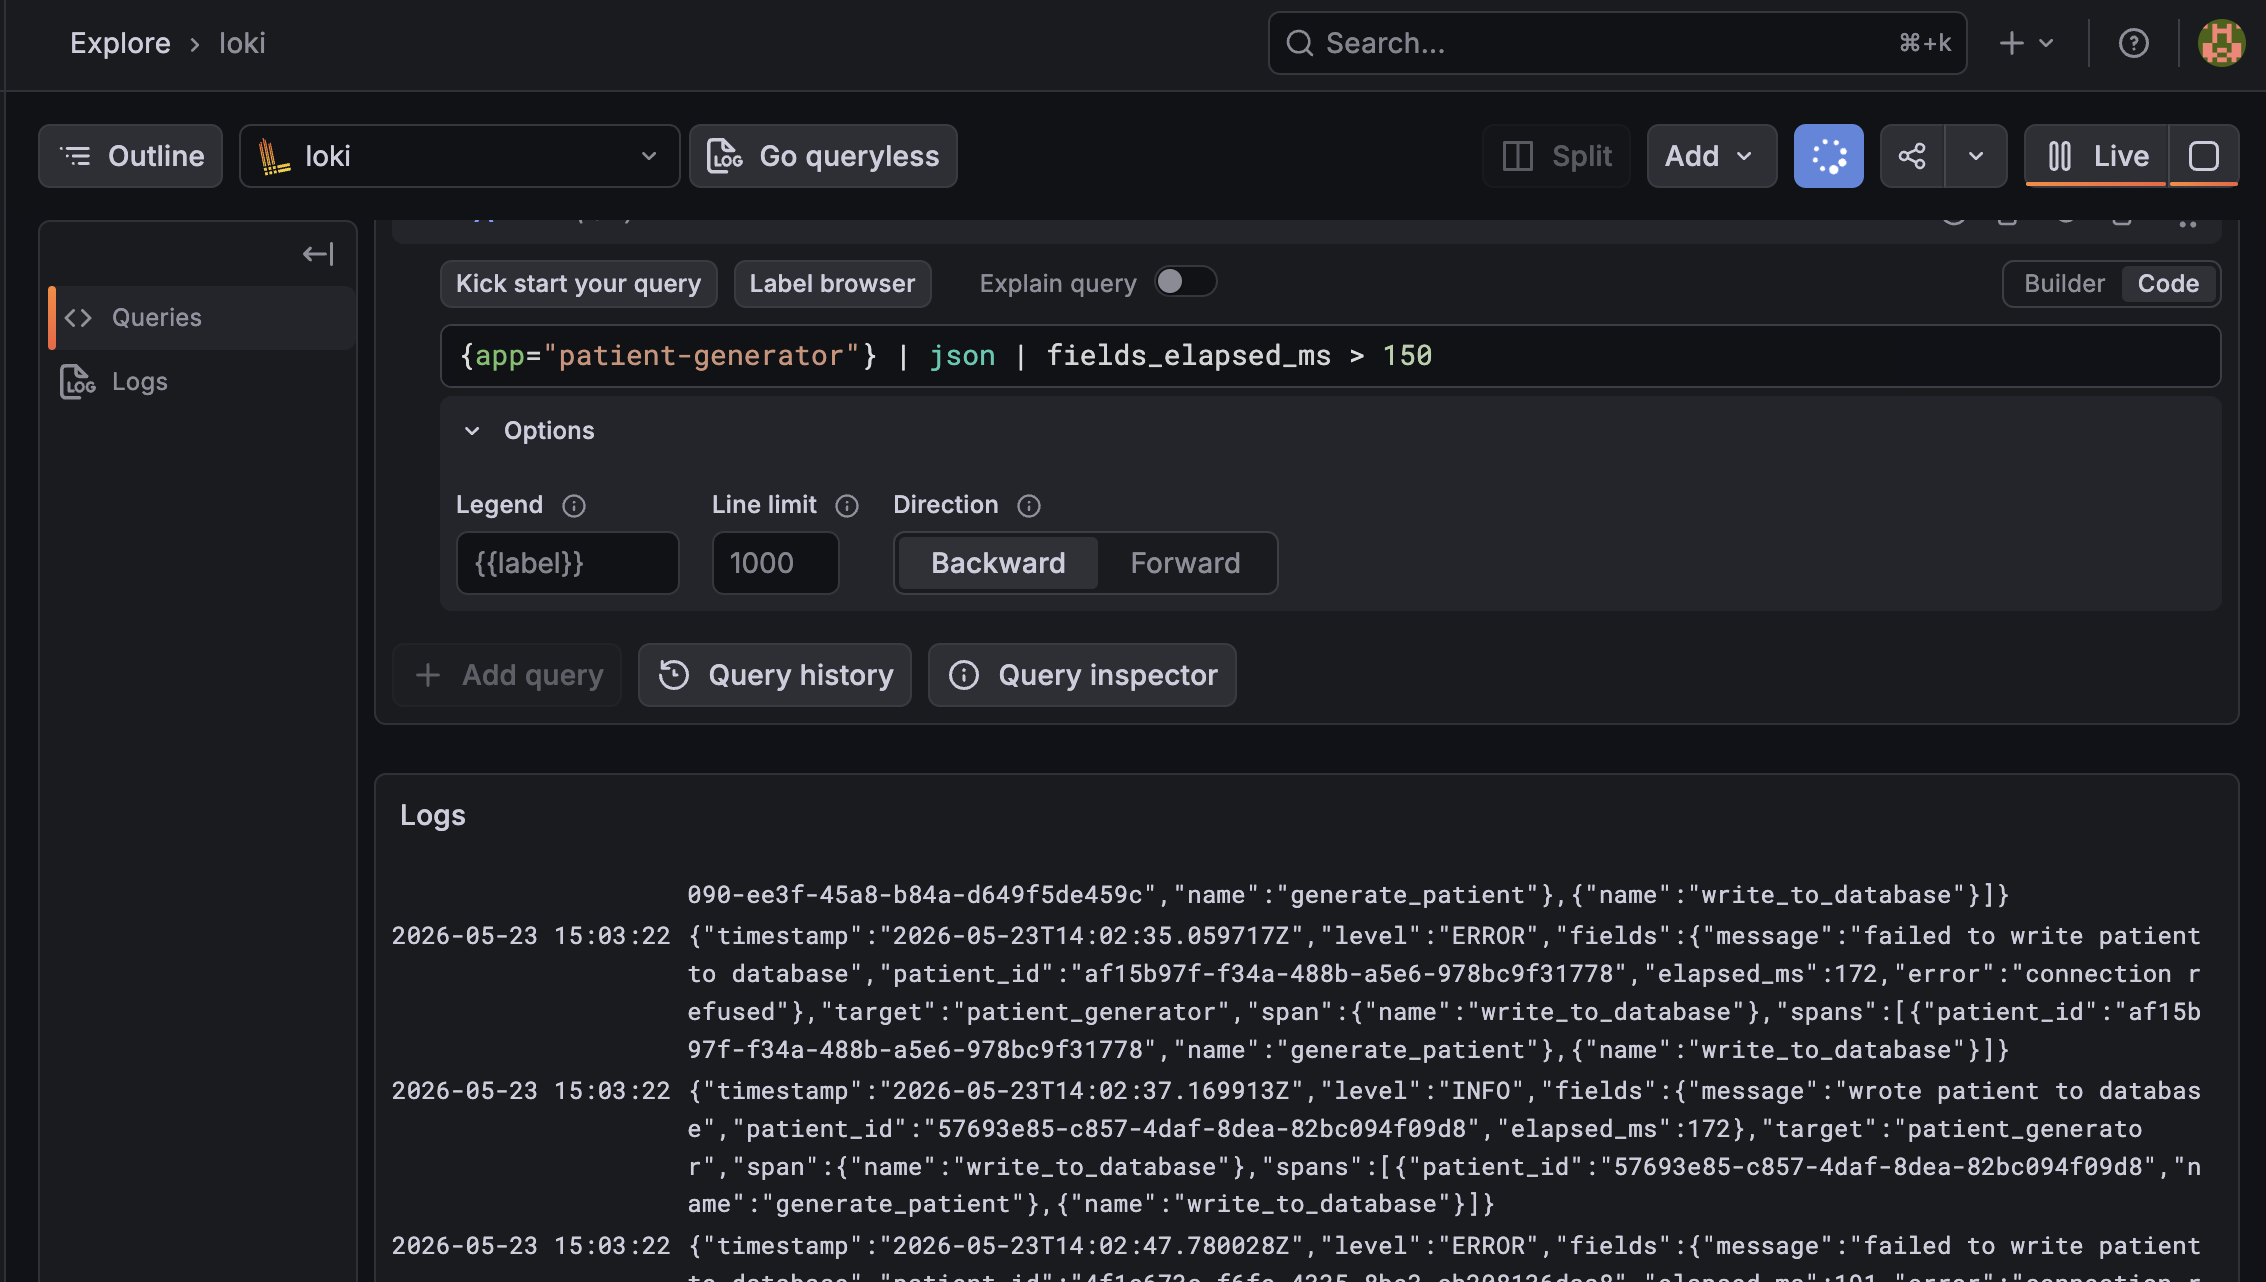
And the query we really care about: finding slow operations. Because we logged elapsed_ms as a numeric field, we can do:
{app="patient-generator"} | json | fields_elapsed_ms > 150
This will show you every log line where the operation took longer than 150 milliseconds.
You can narrow this down further to just slow database writes:
{app="patient-generator"} | json | fields_message="wrote patient to database" | fields_elapsed_ms > 150
This shows you the power of structured logging! We have full control over the fields we log and we can write complex queries in Grafana to find exactly the logs we are interested in. If you want to learn more about the query language, the Loki query documentation is a great resource.
A note on OpenTelemetry
If you are running multiple services and want to correlate traces across them, or you want to unify your logs, metrics and traces into a single pipeline, OpenTelemetry is worth looking into. The tracing-opentelemetry crate integrates well with everything we have covered in this series and the integration is pretty straightforward. It would be overkill for a toy project like this that is designed for introducing the whole concept of logging and tracing, but if you are building a real application with multiple services, OpenTelemetry is a great way to get distributed tracing and to unify your observability data. Grafana has good support for OpenTelemetry data, so you can still use Grafana as your dashboarding tool even if you switch to OpenTelemetry.
There are also a load of other options like Datadog, New Relic, Honeycomb, etc that all support OpenTelemetry, so you have a lot of choice in terms of where you send your data. I am not an expert in OpenTelemetry or in fact any of the commercial tools, but I have been a consumer of the dashboards they produce, and they are so powerful when you have a big system. If you are interested in learning more about OpenTelemetry, the official documentation is a good place to start, and there are some good talks and blog posts out there that go into more detail on how to use it effectively.
Wrapping up
Over these three posts, we have gone from println!("here") to structured, queryable logs in a Grafana dashboard. The journey was: understand what logs are for and when to emit them, add structure with fields and context with spans, and then ship it all somewhere you can actually use it with queries and filters. Along the way we have covered a lot of concepts and there is a lot more to learn if you want to dive deeper, but I hope this has given you a good starting point and that you feel like you can start using these tools in your own projects. The Rust ecosystem has some fantastic libraries for logging and tracing, and the Grafana stack is a great option for log aggregation and dashboarding. With these tools, you can gain much better visibility into your applications and build more reliable software.
If you have enjoyed this series, please consider sharing it with your network or feel free to reach out via my contact page. I contract as a Senior Rust Developer and Epidemiologist, working across healthcare, med tech, gaming and other sectors on projects involving Rust, synthetic data, statistics and research software. I also give talks and workshops on Rust, scientific reproducibility and writing better research code. If any of that sounds relevant to something you are working on, I would love to hear from you!